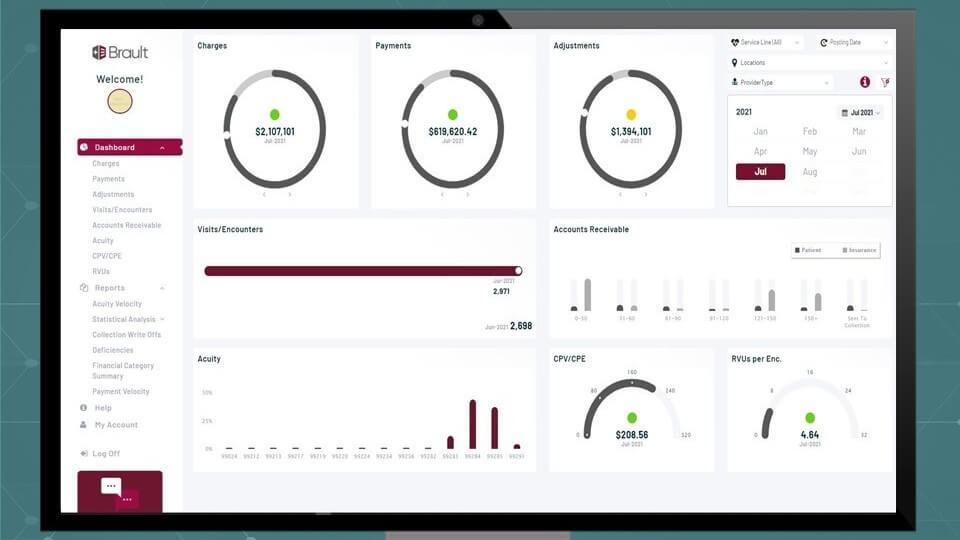
The Brault Analytics suite includes three distinct client portals with views into clinical metrics, revenue cycle data, and business performance benchmarks.

Clients of Brault Practice Solutions will now have access to analytics tools designed to help them better understand their business performance and productivity trends. The Brault Analytics suite features three different Client portals designed for practice leaders, revenue cycle managers, and individual clinicians.
“Analytics are now a vital part of any successful business,” explains Dr. Andrea Brault, President & CEO of Brault Practice Solutions. “But many provider groups lack the technology or resources to analyze their data in a meaningful way. That’s why we developed the Brault Analytics suite.”
Dr. Brault explains that analytics can help a clinical practice understand key metrics at both the Provider-level and Practice-level. These data points can help group leaders identify trends in provider performance, payer behavior, and overall reimbursement. They can also provide a transparent view for individual clinicians to manage their performance and see how they compare to their peers.
“The goal is to help our clients proactively manage their business,” explains Dr. Brault. “Patient volume and reimbursement have continued to fluctuate, and it’s been an ongoing challenge for provider groups to forecast KPIs such as payer velocity, acuity distributions, RVUs, and cash flow.”
The Brault Analytics suite features three distinct Client portals designed for the different roles within a clinical practice.
Practice Management Portal
The Practice Management Portal is designed to provide practice leaders with a comprehensive view of their business KPIs – including cash flow, total encounters, acuity distribution, payment velocity, and individual payer performance. Users can also customize performance goals and drill down into near real-time views of this data.
Patient Account Tracker
The Patient Account Tracker allows RCM leaders to track the flow of charts in their revenue cycle. Users can look into every chart in their RCM production cycle and drill down into areas such as patient volume, coding and billing activity, and individual payer performance. Users can also drill down into provider details such as documentation habits and pended charts.
Provider Performance Dashboard
The Provider Dashboard is designed for the individual clinician. It provides a snapshot of a clinician’s day-to-day work, including patients per hour, RVUs, RVUs per visit, and acuity level distributions. Providers can also compare their individual performance against their peers and overall group trends.
About Brault Practice Solutions
For over 30 years, Brault has helped clinical practices manage their revenue cycle and business operations – with practice solutions designed for coding, billing, MIPS optimization, and provider documentation training.
Learn more at www.Brault.us


